Top 8 Heat Maps 2026: How to Choose the Best One for You?

Heat maps used to be simple visual overlays showing where people click or scroll your website or landing page. Over the past few years, though, they’ve transformed into full behavioral analytics platforms. They now offer session replays, funnel visualization, predictive modeling, integrations, and much more.
And yes, they can be a great tool in your arsenal! That is why, today, we provide detailed reviews of 8 heat maps aka behavior-analytics tools to help you choose the right one for your affiliate flows!
What Are Heat Maps (and Why They Matter)
At their core, heat maps visualize user behavior on a page. But in modern tools, they’re much more than static overlays.
Core value of heat maps
- They show where users’ attention goes (and doesn’t go)
- They help uncover friction, blind spots, or poor placements
- Over time, they guide conversion optimization (refining CTAs, relocating key content)
- When tied to segments and filters, they let you compare behavior across user types (mobile vs desktop, new vs returning, etc.)
Beyond simple heat maps
Modern platforms layer heat maps with these capabilities:
- Session replays or recordings: watch exactly how users moved around
- Funnels and drop-off analysis: see where users leave your affiliate flow
- Form and field analysis: identify where people abandon or struggle
- Integrations and APIs: tie behavior to campaigns, A/B tests, analytics suites
- Predictive and AI overlays: estimate attention or gaze without needing all real data
Thus, heat maps now tend to be a module inside behavior analytics suites. That’s why when choosing a tool, you want to look at the whole package, not just click maps.

Types of Heat Maps and Related Tools
Here’s a list of the common types and related elements you’ll see in modern tools:
| Tool | What it shows | Use case |
| Click map | Where users click or tap | Spot underused links, misplaced CTAs |
| Scroll map | How far down users scroll | Decide where to place important content and CTAs |
| Movement map | Where the mouse moves or stays | Underastand attention flow |
| Attention map | Combined metric of where attention is focused | Estimate where users looked most (sometimes predictive) |
| Session recordings | A video of how a user navigated the pages | Diagnose UX issues, see behavior flows |
| Funnel path | Where users leave in a conversion sequence | Debug affiliate steps or landing flow issues |
| Form and field metrics | Where people hesitate or abandon form fields | Improve lead or signup forms |
A good tool will let you mix and match of those – say, view click/scroll heat maps for a funnel segment, then watch the sessions of users who dropped off after a specific step. This provides a full picture for your further analysis. And now…
8 Tools for Heat Maps and Behavior Analytics
And now let’s get into the tools themselves and see what you can use for your experiments and user behavior analysis.
1. Hotjar
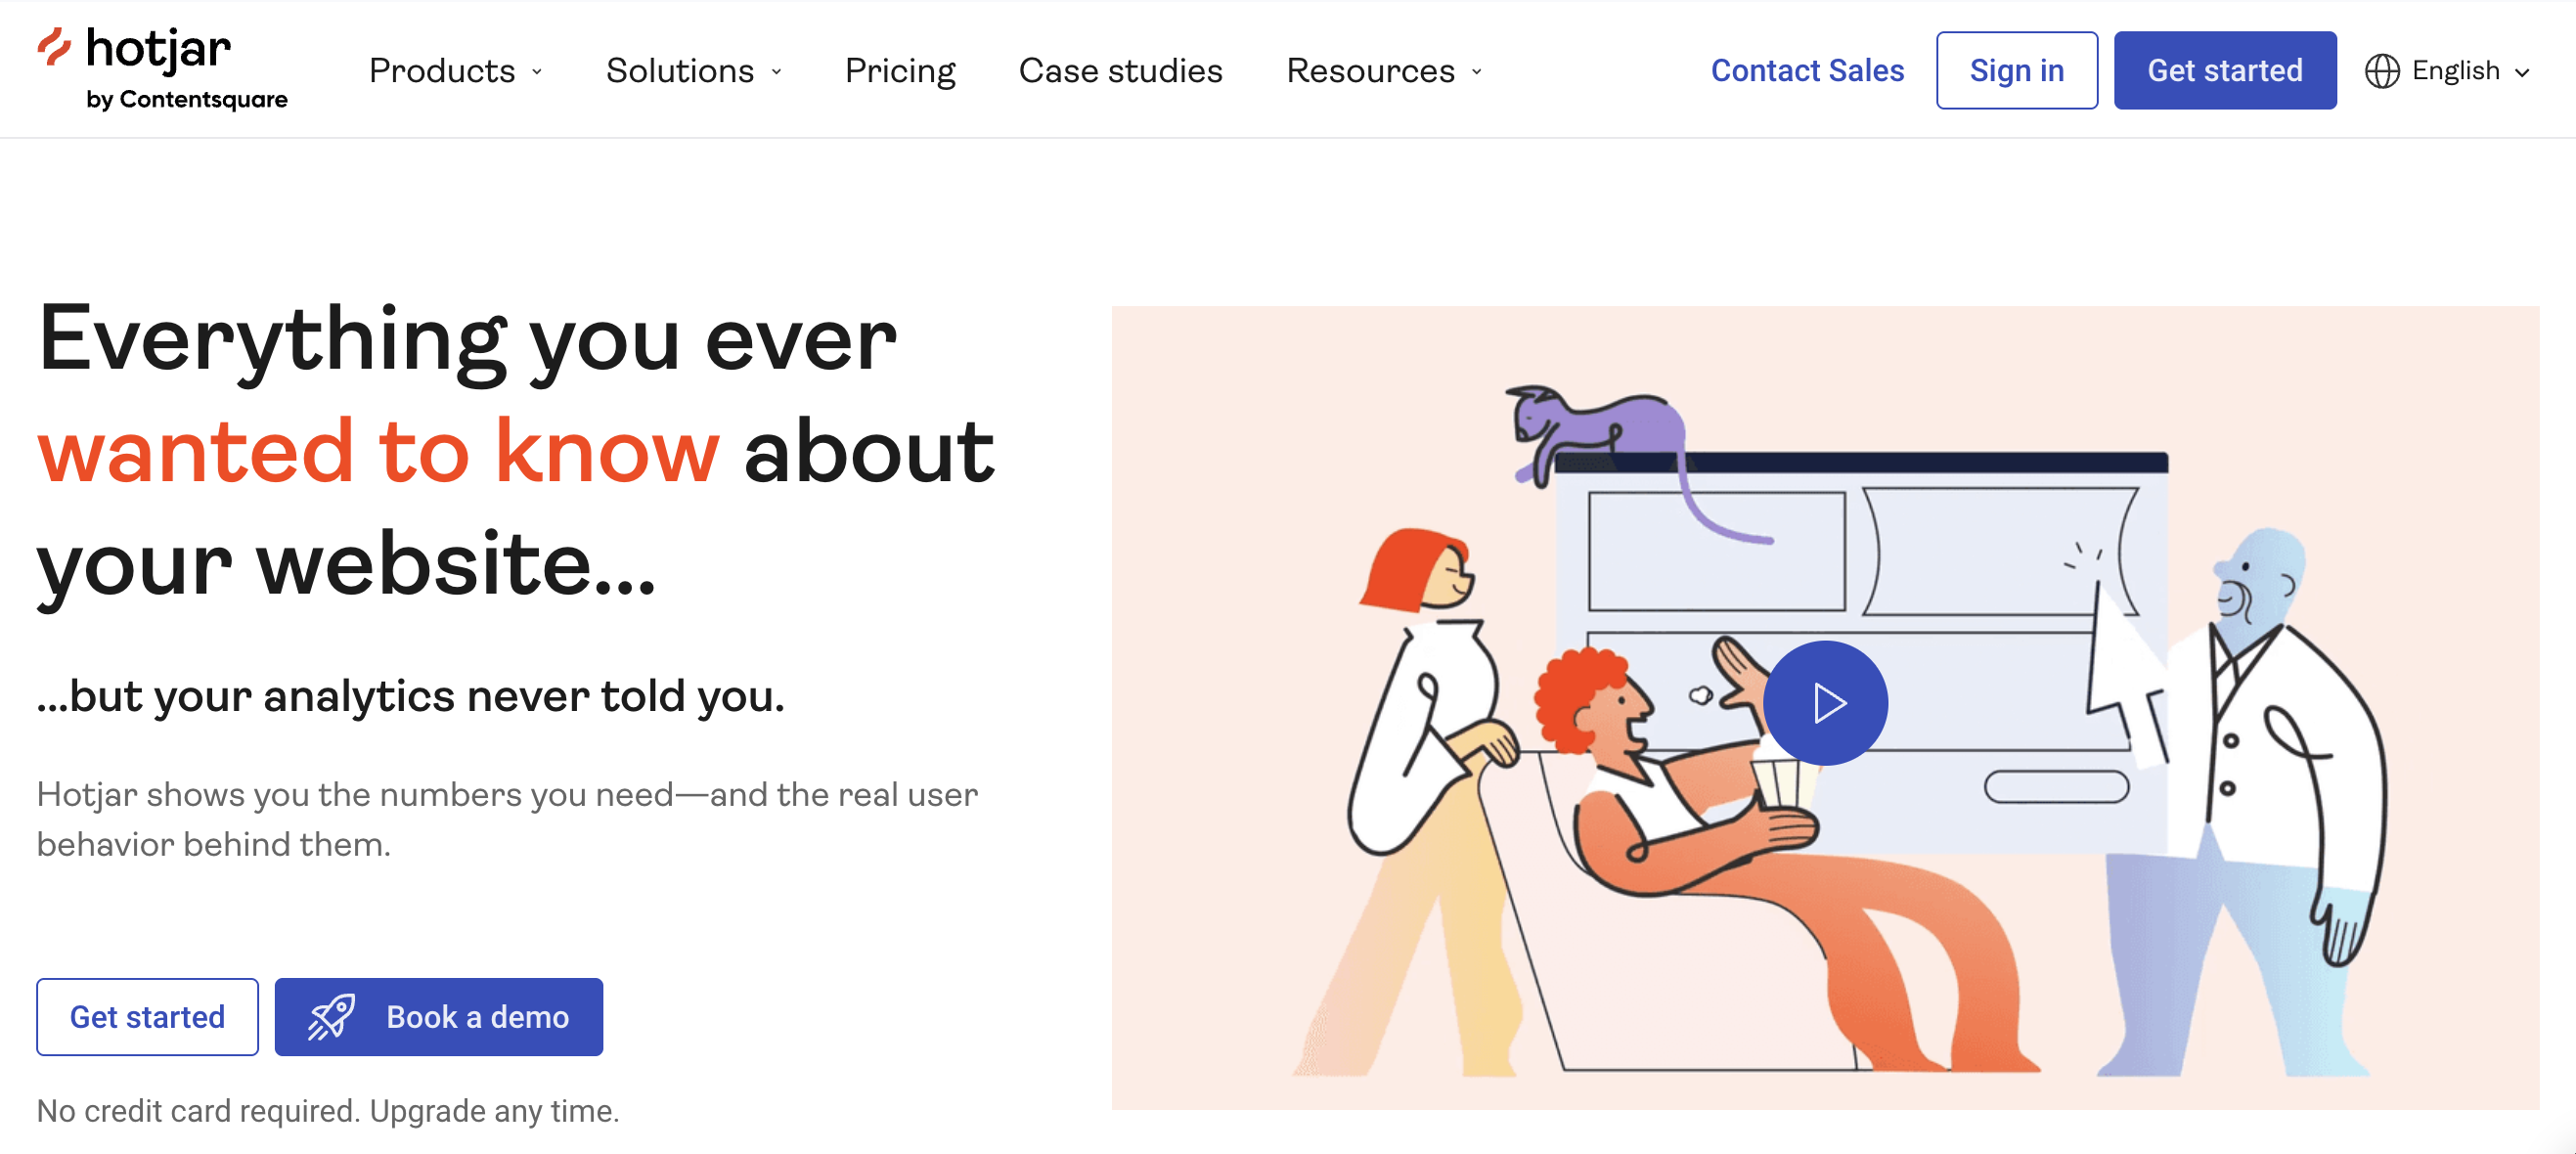
Price: from $39/month
Free version: yes, Basic package with 35 daily sessions
Hotjar is divided into three product modules: Observe (heatmaps, session recordings, funnels), Ask (surveys, feedback), and Engage (user interviews). You pick the module(s) you need per site.
Hotjar can boast of polished UI and solid export/sharing features. The pricing is pretty flexible, since you can exclude those services you are not going to use from the package you buy (say, if you don’t want surveys – you don’t have to pay for them).
Features you may like:
- Unlimited heatmaps (within session limits)
- Session recordings with filtering by device, browser, custom events
- Behavior and experiment filters, frustration and engagement scoring
- Funnels, trend analysis, console (JavaScript) error tracking, webhooks
- Export and share heatmaps, recordings, feedback – shareable URLs, image downloads, CSV exports
2. Lucky Orange
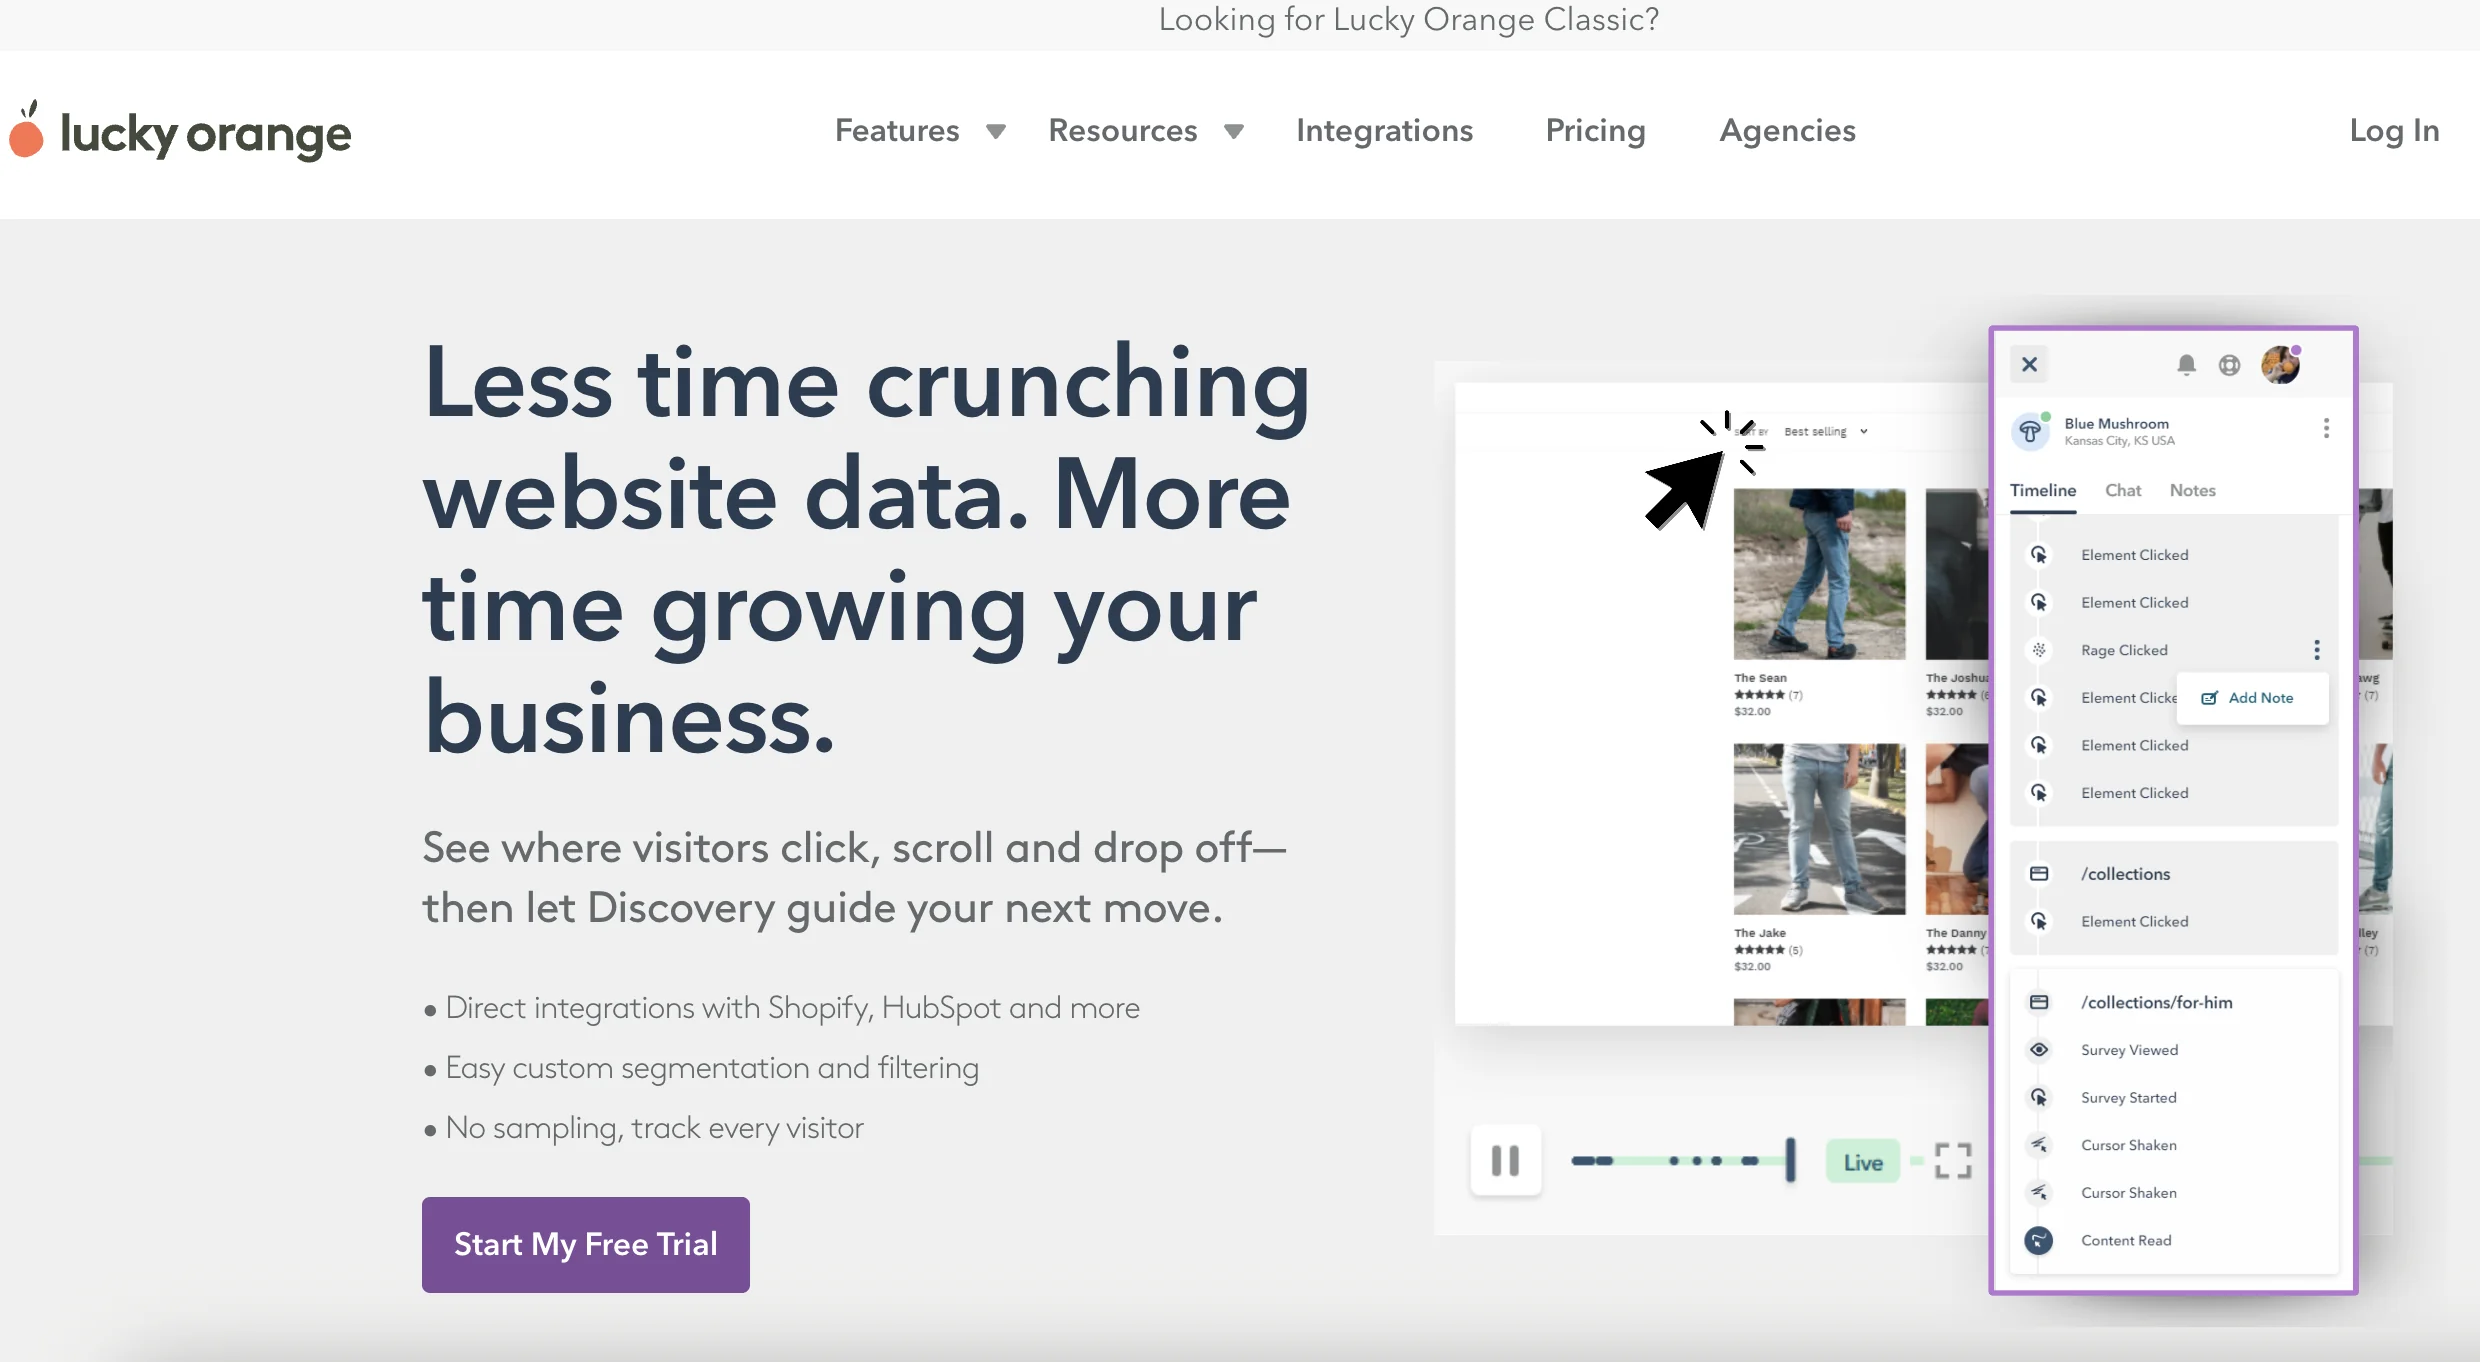
Pricing: from $32
Free version: yes, up to 100 monthly sessions
Lucky Orange is a real-time behavior analytics suite with Dynamic Heatmaps (click, scroll, move) that work on dynamic elements (dropdowns, popups, carousels) and let you toggle by device and filter audiences.
Features you may like:
- Dynamic Heatmaps with device toggles and advanced filtering; built to track dynamic content and modern frameworks.
- Session Recordings with targeting/segments (inclduing high cart value, UTM source, “frustrated/confused” visitors) and Live View.
- Funnels, Form Analytics, Visitor Profiles – all available alongside heatmaps.
- Integrations with Shopify, HubSpot, Google Analytics/GA4, WordPress, Zapier, GTM, and more.
3. Plerdy
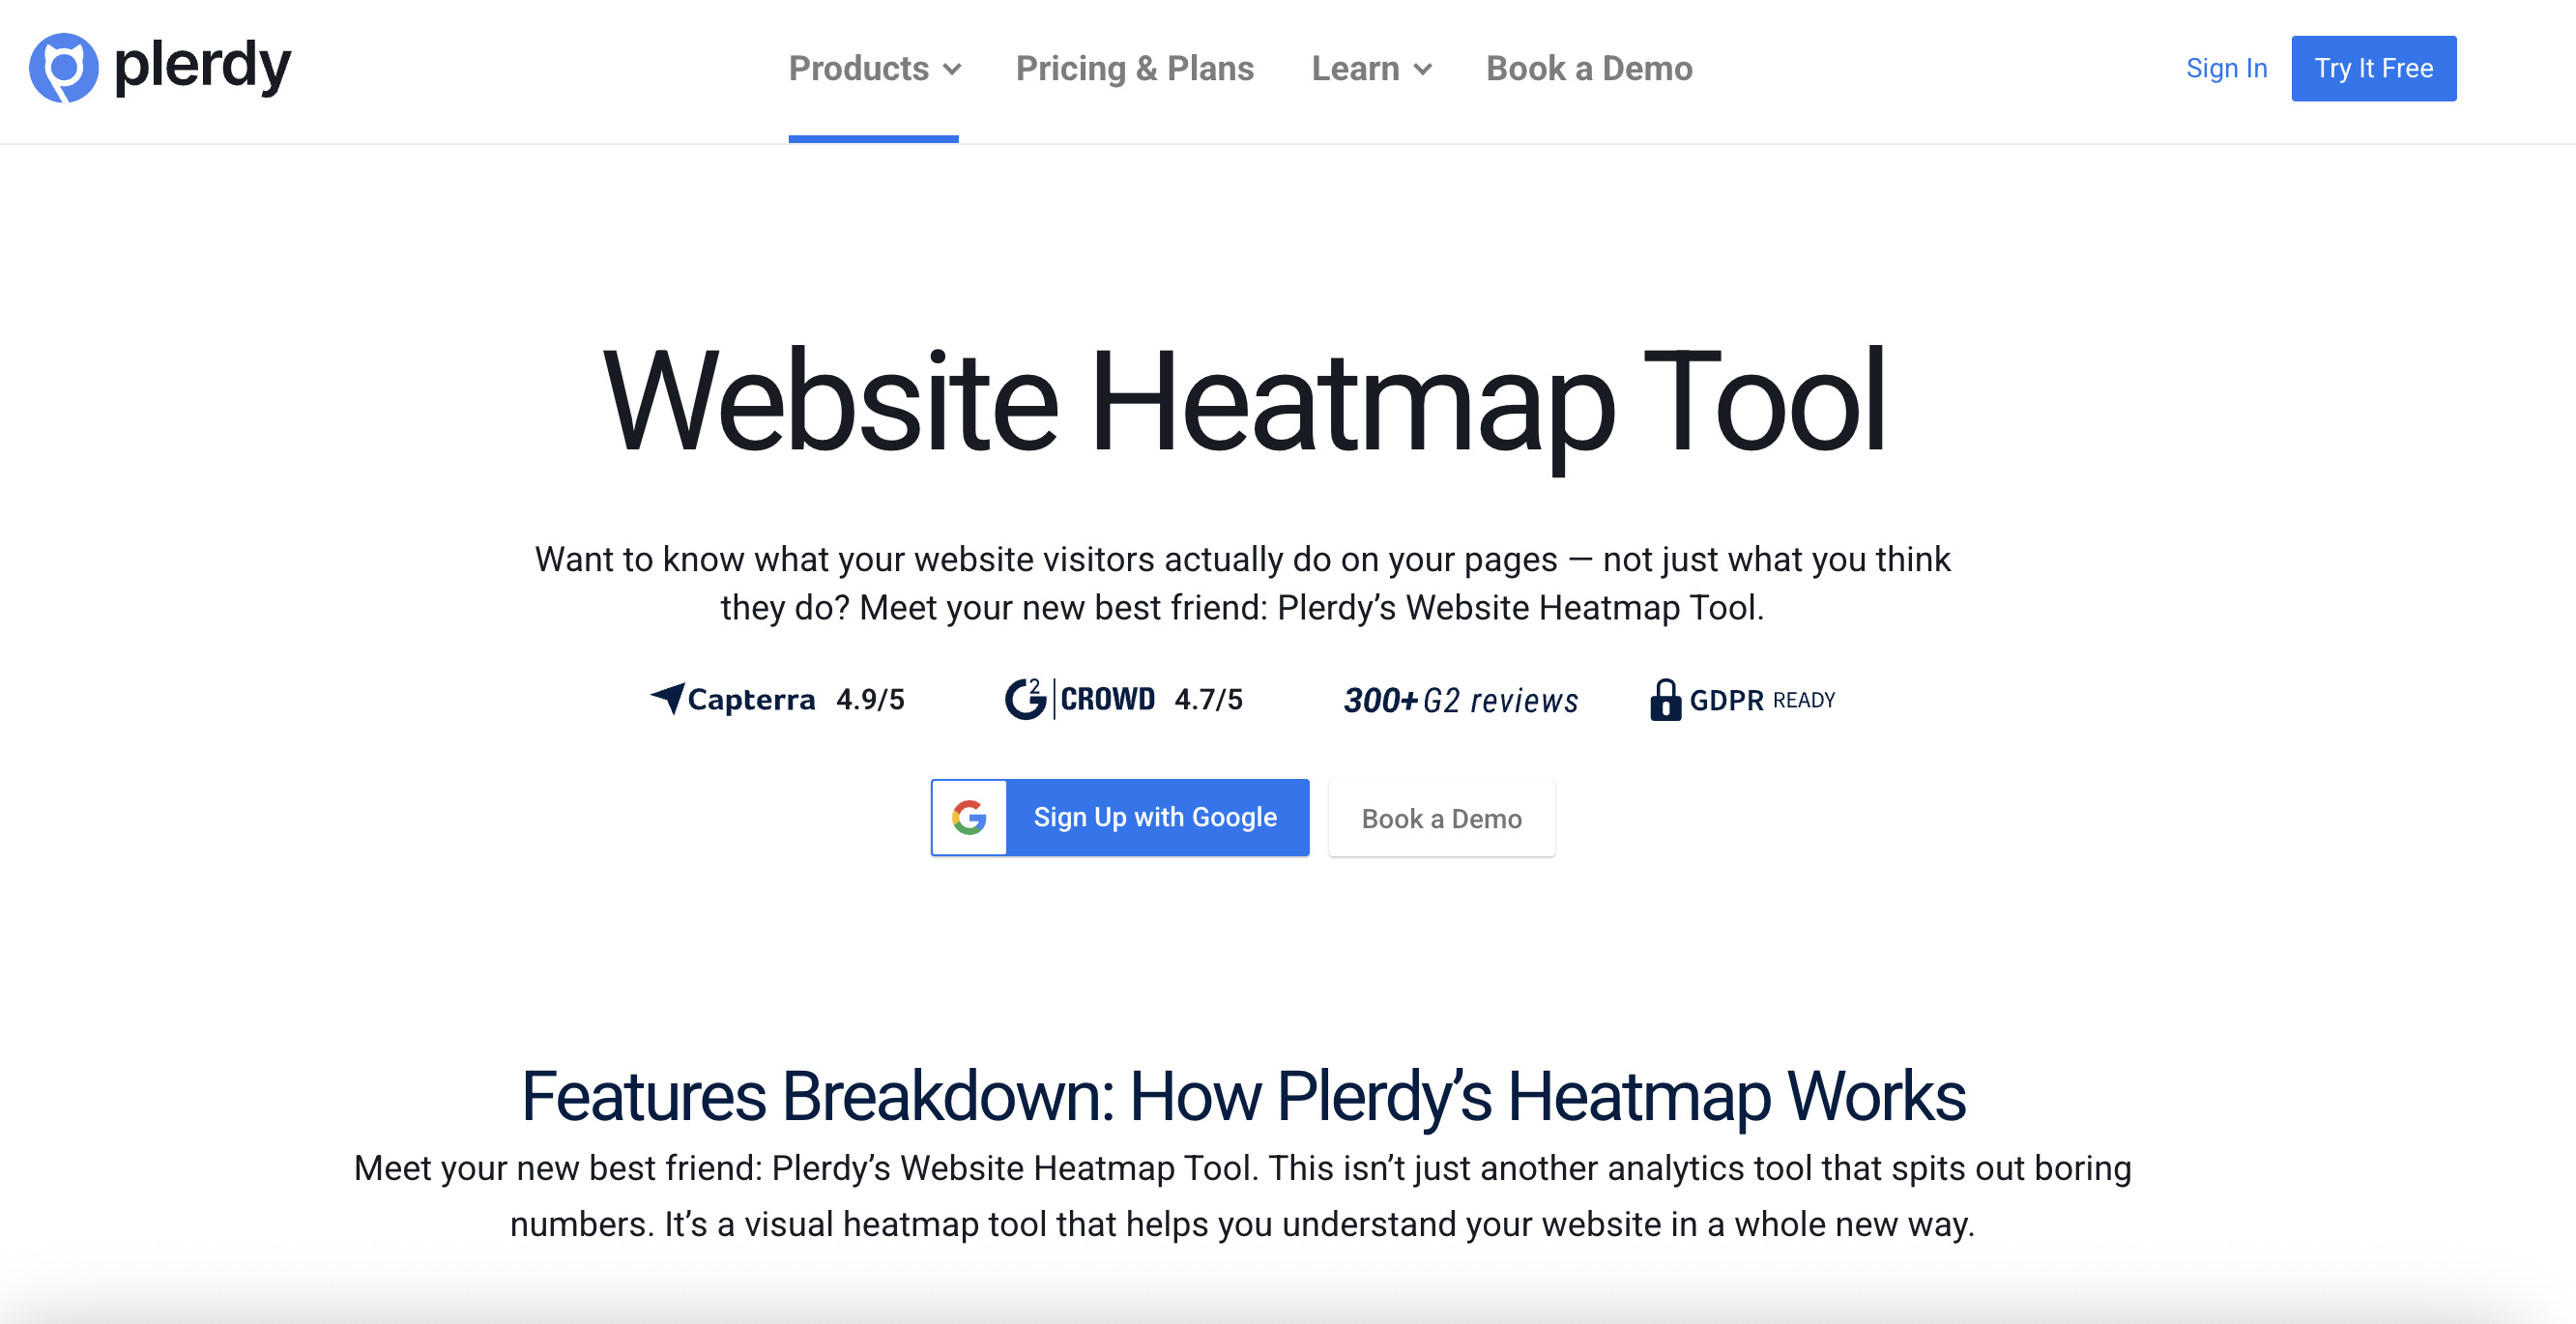
Pricing: from $32
Free version: yes, with limited tools
Plerdy is an all-in-one UX/behavior analytics suite combining advanced heatmaps, session recordings, pop-ups, funnels, and AI/UX assistance. It’s pretty feature-rich and has tools beyond heat maps, like event tracking and SEO auditing, but here you can also use (and buy) only the parts you need. Still, because so many features are folded in, the interface can feel crowded.
Features you may like:
- Click, scroll, and movement heatmaps
- Click path and “first-click” path analytics to see navigation trails
- Session recording
- A/B testing
- Conversion funnels, pop-ups, SEO audit
- AI prediction and UX assistant features to suggest improvements
4. Crazy Egg
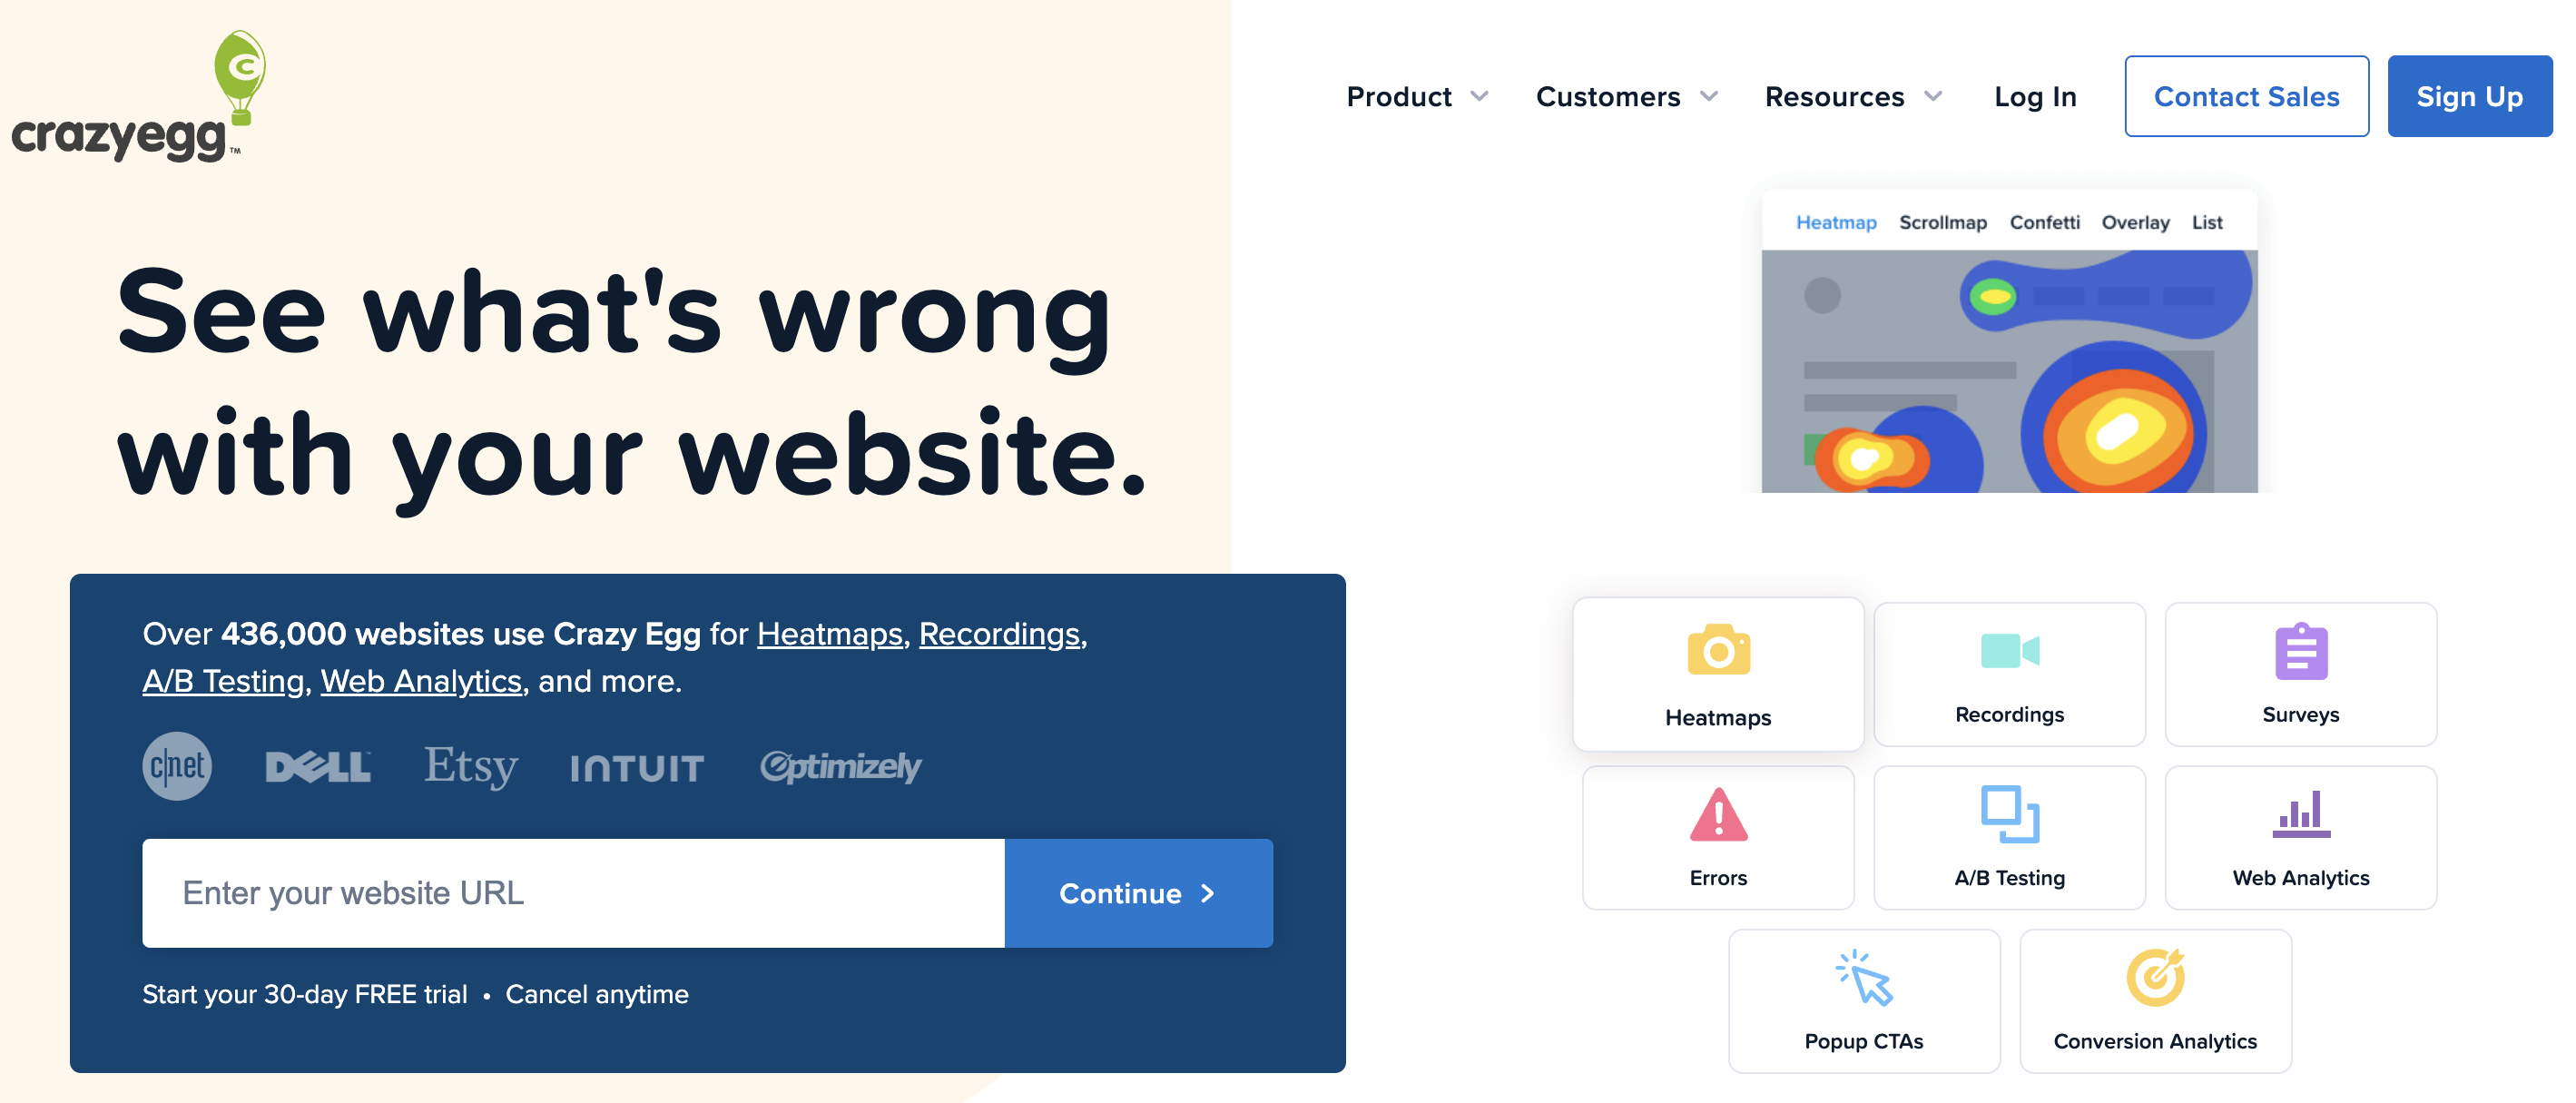
Pricing: from $29/month
Free version: 30 day free trial
Crazy Egg is a hybrid tool combining classic heatmaps with session recording, A/B testing, and conversion analytics capabilities. It tends to use a “snapshot” model (you define snapshots you want to monitor) rather than always-on tracking.
This model gives you budget control on the one hand (you pay for what you are actively testing now), but on the other hand, you might miss behavior on pages you didn’t explicitly track. Still, the multi-report approach per snapshot is powerful (heatmap, overlay, confetti, list) giving various visual perspectives.
Features you may like:
- Click maps, scroll maps, overlay visualizations
- Session recordings and replays
- A/B testing module built-in (run variants and see heatmap outcomes)
- On-page surveys
- Custom reports and visualizations
5. FullStory
Pricing: upon request
Free version: free trial available
FullStory is a bit extra, since its more of a behavioral analytics and digital experience platform than a pure heatmap tool. Its core strength is full session capture + search, filtering and deep behavioral analytics. Because of its depth, could be overkill (and costly) for simple affiliate landing page needs and product teams.
Features you may like:
- Click and scroll heatmaps, but tightly tied to segments and filters
- Session replay and recordings with rich metadata
- FullCapture tool, an automatic capture of all user events without needing manual instrumentation
- Error tracking, console logs, JavaScript errors integrated
- Collaborations, user segmentation, analytics dashboards
- Privacy and data masking, + compliance features
6. Capturly
Pricing: from $29/month
Free version: yes
Capturly is a behavior analytics platform that helps you visualize how visitors interact with your website. It combines heatmaps, session replays, funnels, and event tracking in one interface – giving you a full picture of how users browse, click, and convert. It’s especially useful for spotting friction points, improving page layouts, and monitoring conversion performance.
Features you may like:
- Click, scroll, and segment heat maps
- Session recordings, including rage clicks and back-and-forth navigation
- Conversion funnels tracker to see how many visitors reach each step and where they drop off
- Event analytics
- JavaScript or interaction errors tracking
- Simple setup for WordPress, Shopify, WooCommerce, Magento, and other CMS platforms
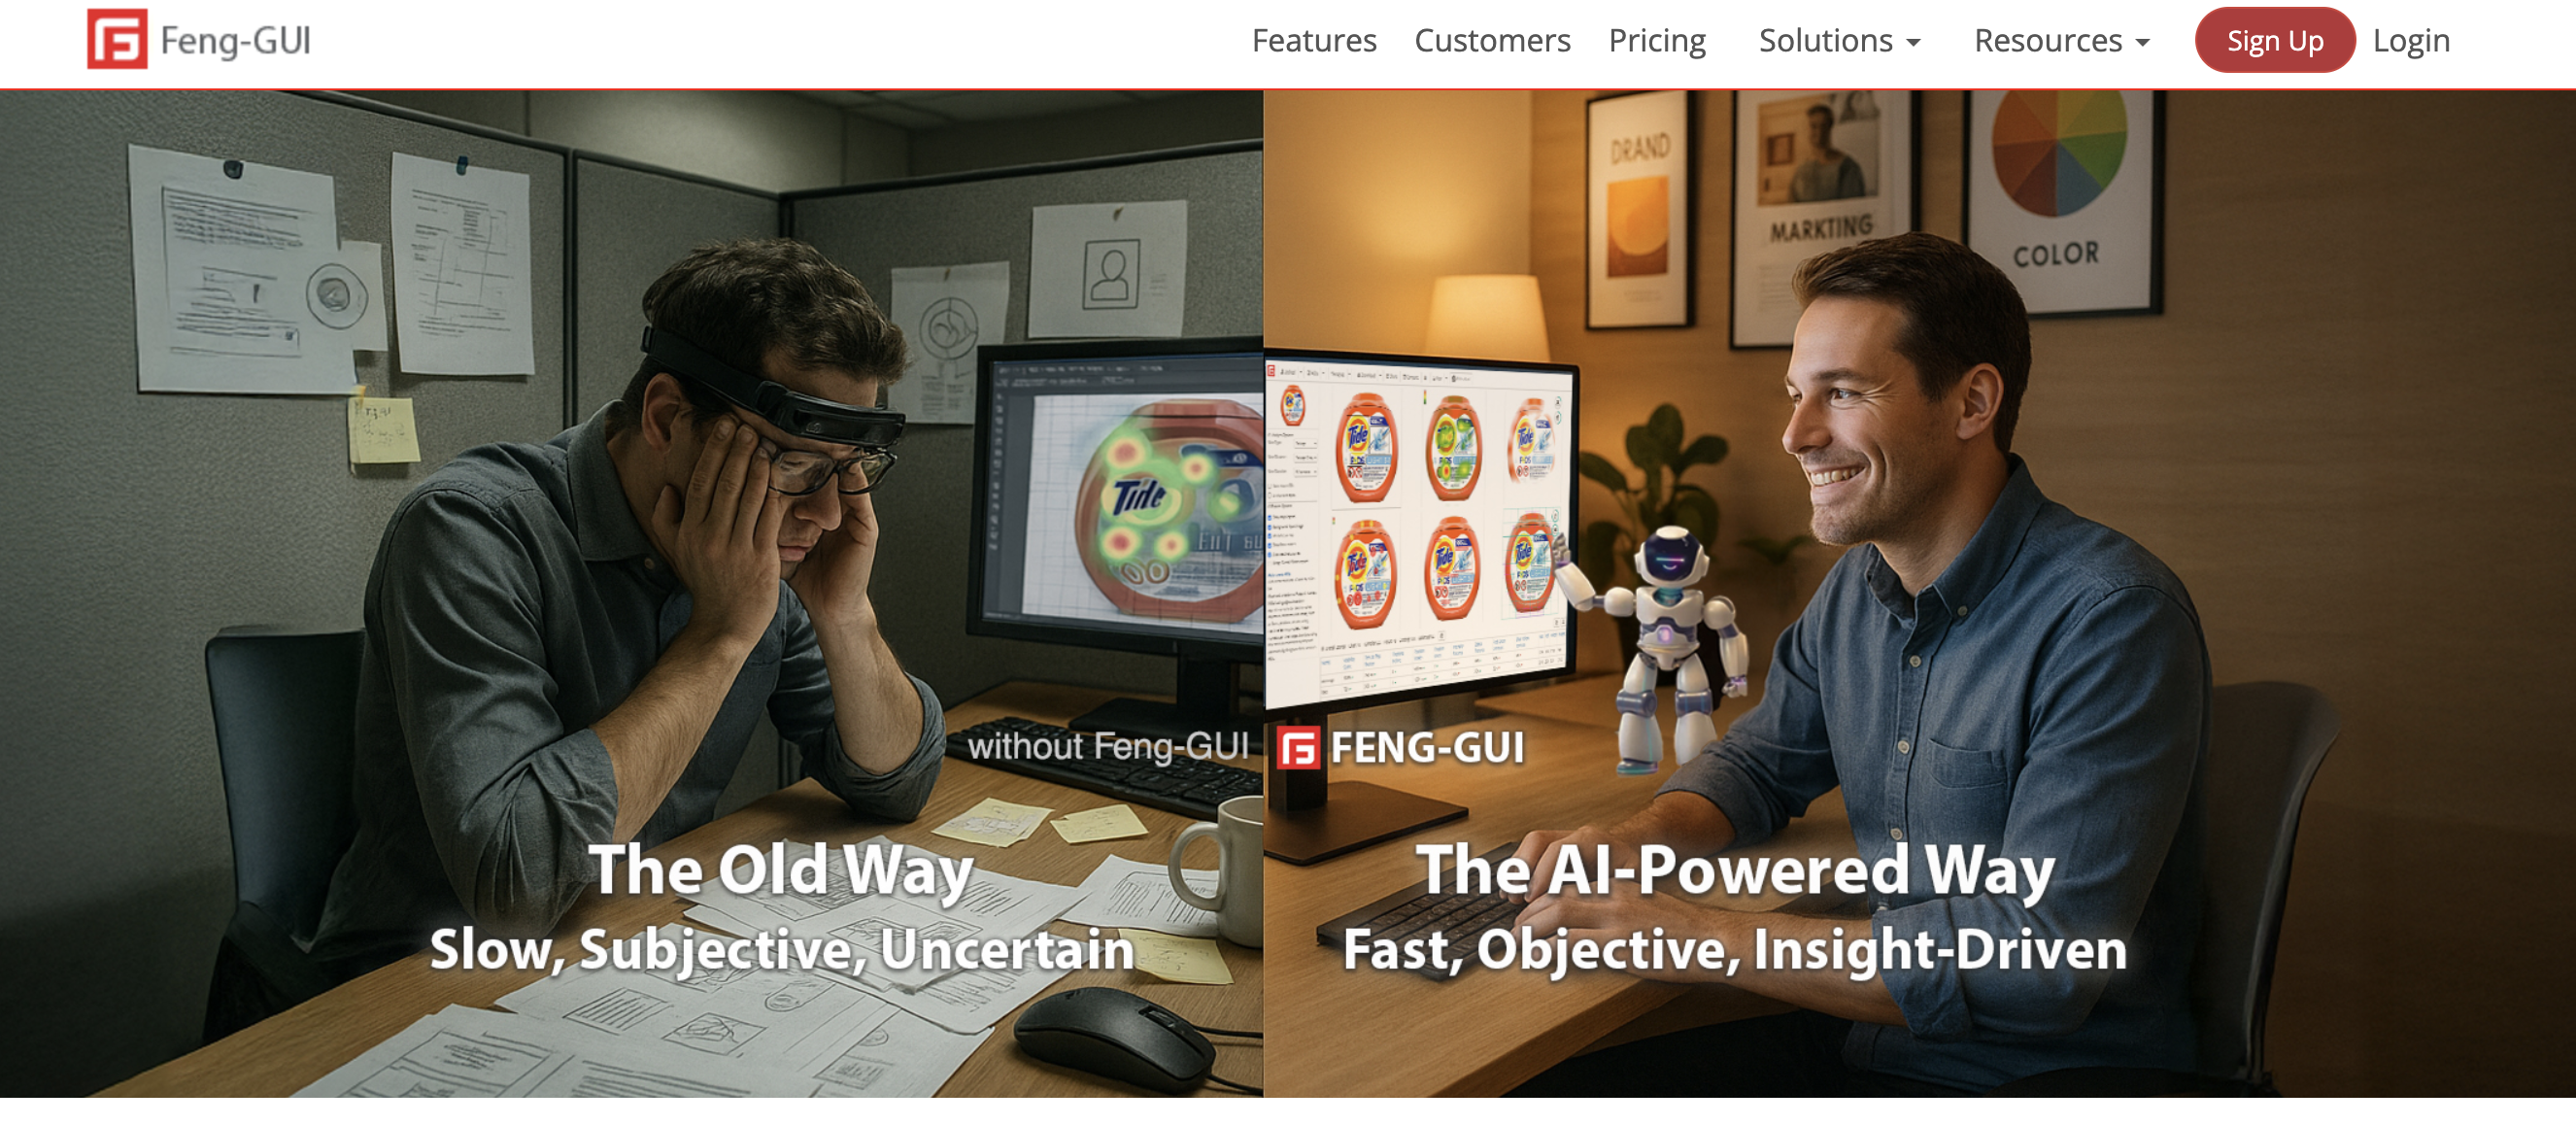
7. Feng GUI
Pricing: from $67 for business
Free version: no
Feng GUI isn’t a traditional behavior tracker – it’s an AI-powered visual attention simulator. Sounds cool? Instead of collecting live data, it predicts where users’ eyes are likely to focus when viewing a design. It’s perfect for pre-launch testing or evaluating creatives, banners, and landing pages before they go live.
Features you may like:
- AI attention heatmaps to predict how real users would visually explore an image, webpage, or video frame
- Gaze plot reports to predict order of eye fixations and reveal the visual flow
- Focus maps to highlight the elements that actually attract attention
- Aesthetics metrics that analyzes clarity, complexity, balance, and emotional appeal to guide design decisions.
8. MouseFlow
Pricing: from $25/month
Free version: yes, 500 sessions/month
Mouseflow is a full-featured session replay and heatmap analytics tool that captures how users navigate, click, scroll, and fill forms. It’s built for marketers and UX specialists who need to understand why visitors drop off or convert – ideal for refining funnels and landing page performance.
Features you may like:
- Automatically generated click, scroll, and attention heatmaps for every page
- Session recordings
- Step-by-step conversion funnels creation to see where users leave and which sources convert best
- Form analytics, surveys, and polls
- Automatic detection of “rage clicks,” quick backtracks, and hesitation, helping pinpoint usability pain points
- Integrations with Google Analytics, HubSpot, Shopify, and major CMS / marketing tools.

How to Choose the Right Heat Map for Your Needs?
If you are not sure, which tool is the one for you, below is a decision matrix: match your primary use scenario (traffic level, goals, complexity) to the tool(s) that tend to perform best in that space. Remember that this is a general guide – always consider your specific needs, budget, and growth plans.
| Scenario | Recommended tools | Why it works? |
| Low traffic or first tests | Hotjar, Capturly, Plery | These tools provide essential heatmaps and session captures at low cost, allowing you to validate pages without overpaying. |
| Mid-level funnels and landing pages | Mouseflow, Hotjar, Lucky Orange | These tools support segmentation, funnel tracking, and enough session coverage to analyze patterns in moderate traffic flows. |
| Heatmaps + A/B testing in one platform | Crazy Egg | Their built-in A/B testing with snapshot + heatmap overlays can reduce your tool stack. |
| Deep behavior analytics and debugging | FullStory, Mouseflow | When you want full session capture, advanced filtering, console logs, error insights, these are your heavy hitters. |
| Predictive and design-stage evaluation | Feng GUI | Before you get real traffic, Feng GUI predicts where visual attention will fall – ideal for testing layouts or creative variants. |
Final Thoughts
Heat maps in 2026 aren’t standalone features – they’re mostly part of a richer behavior analytics ecosystem, enriched with AI and deep behavioral tools.
The best service for you depends on your traffic, funnel complexity, budget, and need for integrations.
So opt for the tools you prefer and let your users’ desires become even more transparent and your profit grow!
Join our Telegram for more insights and share your ideas with fellow-affiliates!